SERVICE DESIGN
DASHBOARD
SCHOOL PROJECT
RefiT
Designing a circular service for community impact
Role
Lead Product Designer
Team
2 x User Researchers
2 x Product Designers
Timeline
April - June 2025
Tools
Figma
Adobe photoshop
Adobe illustrator
Description
A community-powered service to turn plastic bottles into affordable team jerseys
Problem Space
Why Focus on Plastic?
" 450 million metric tons of plastic packaging waste annually. That’s projected to triple by 2050. "
YALE INSIGHTS - SECONDARY RESEARCH
Plastic waste is rising, but most people lack accessible ways to take part in reuse.
We explored packaging across its lifecycle, from production to disposal, to explore how packaging can be reimagined for sustainable impact.
Research & Insights
Understanding the Context
To uncover actionable opportunities, we triangulated insights across three methods:


Secondary research synthesis
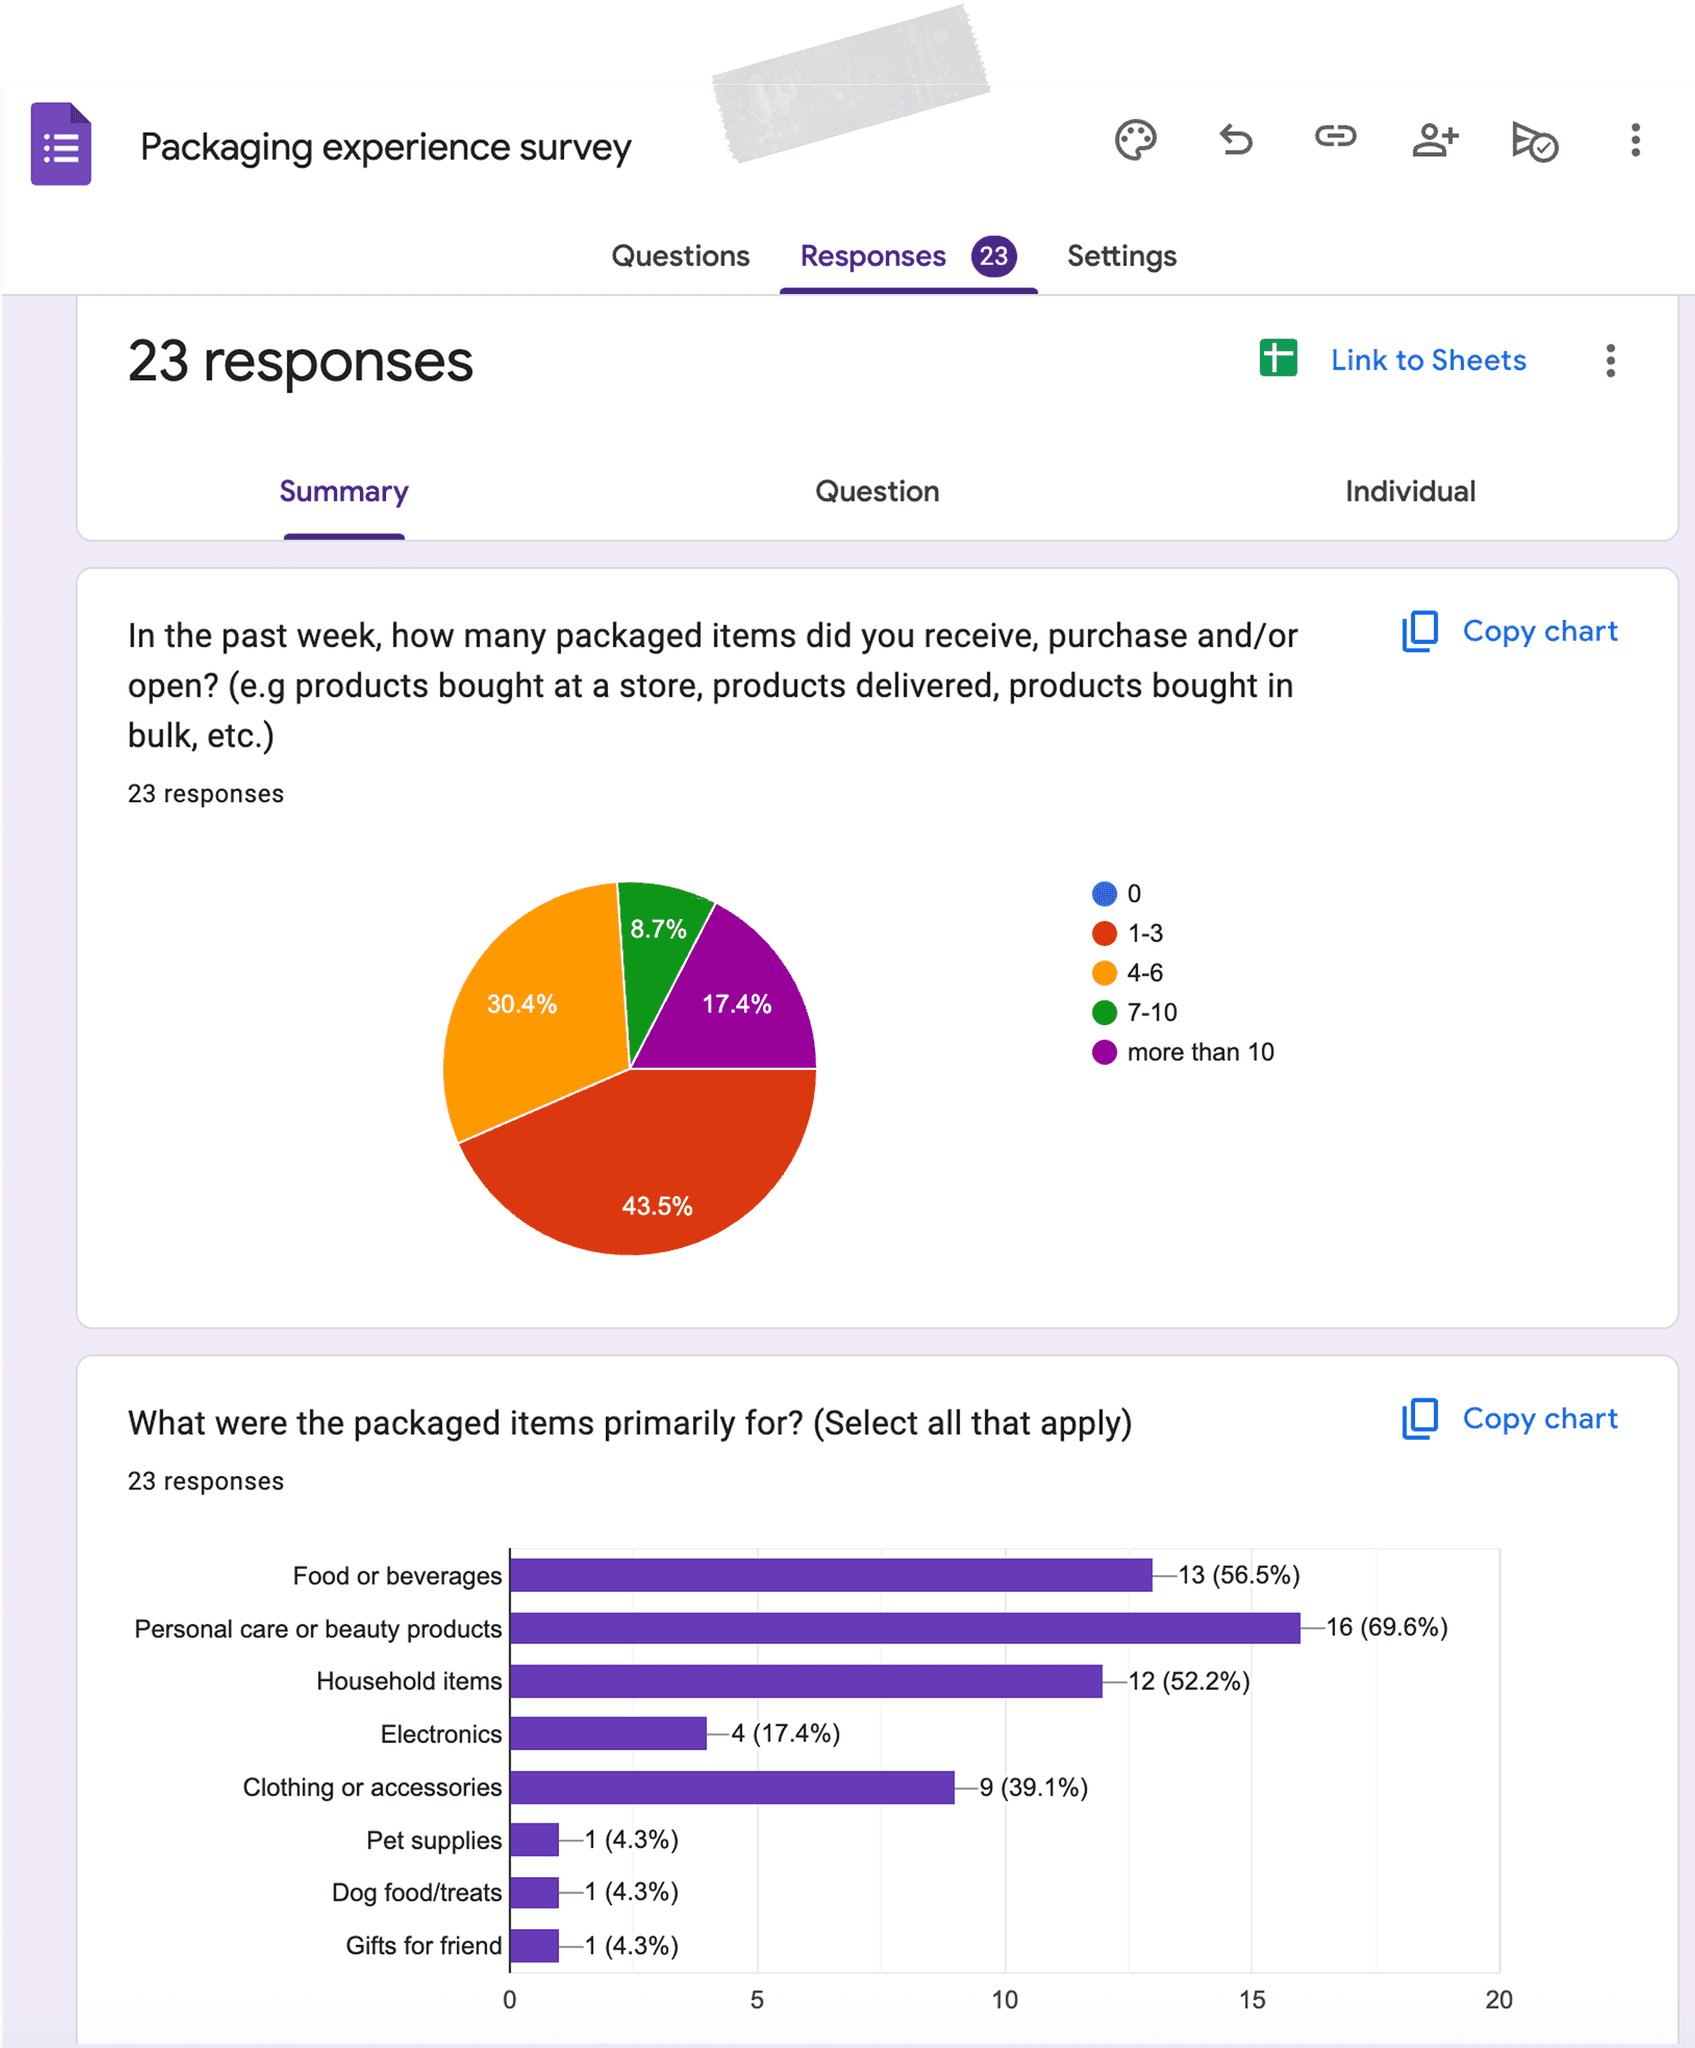
Survey form

CO-DESIGN FIGJAM BOARD
Secondary research showed macro trends:
High-tech recycling exists (e.g., Repreve), but often lacks community engagement and visibility.
Surveys and interviews helped us understand consumer behaviors and attitudes:
Consumer decisions are driven by convenience, habit, and visual appeal.
Sustainability is valued but often not the deciding factor.
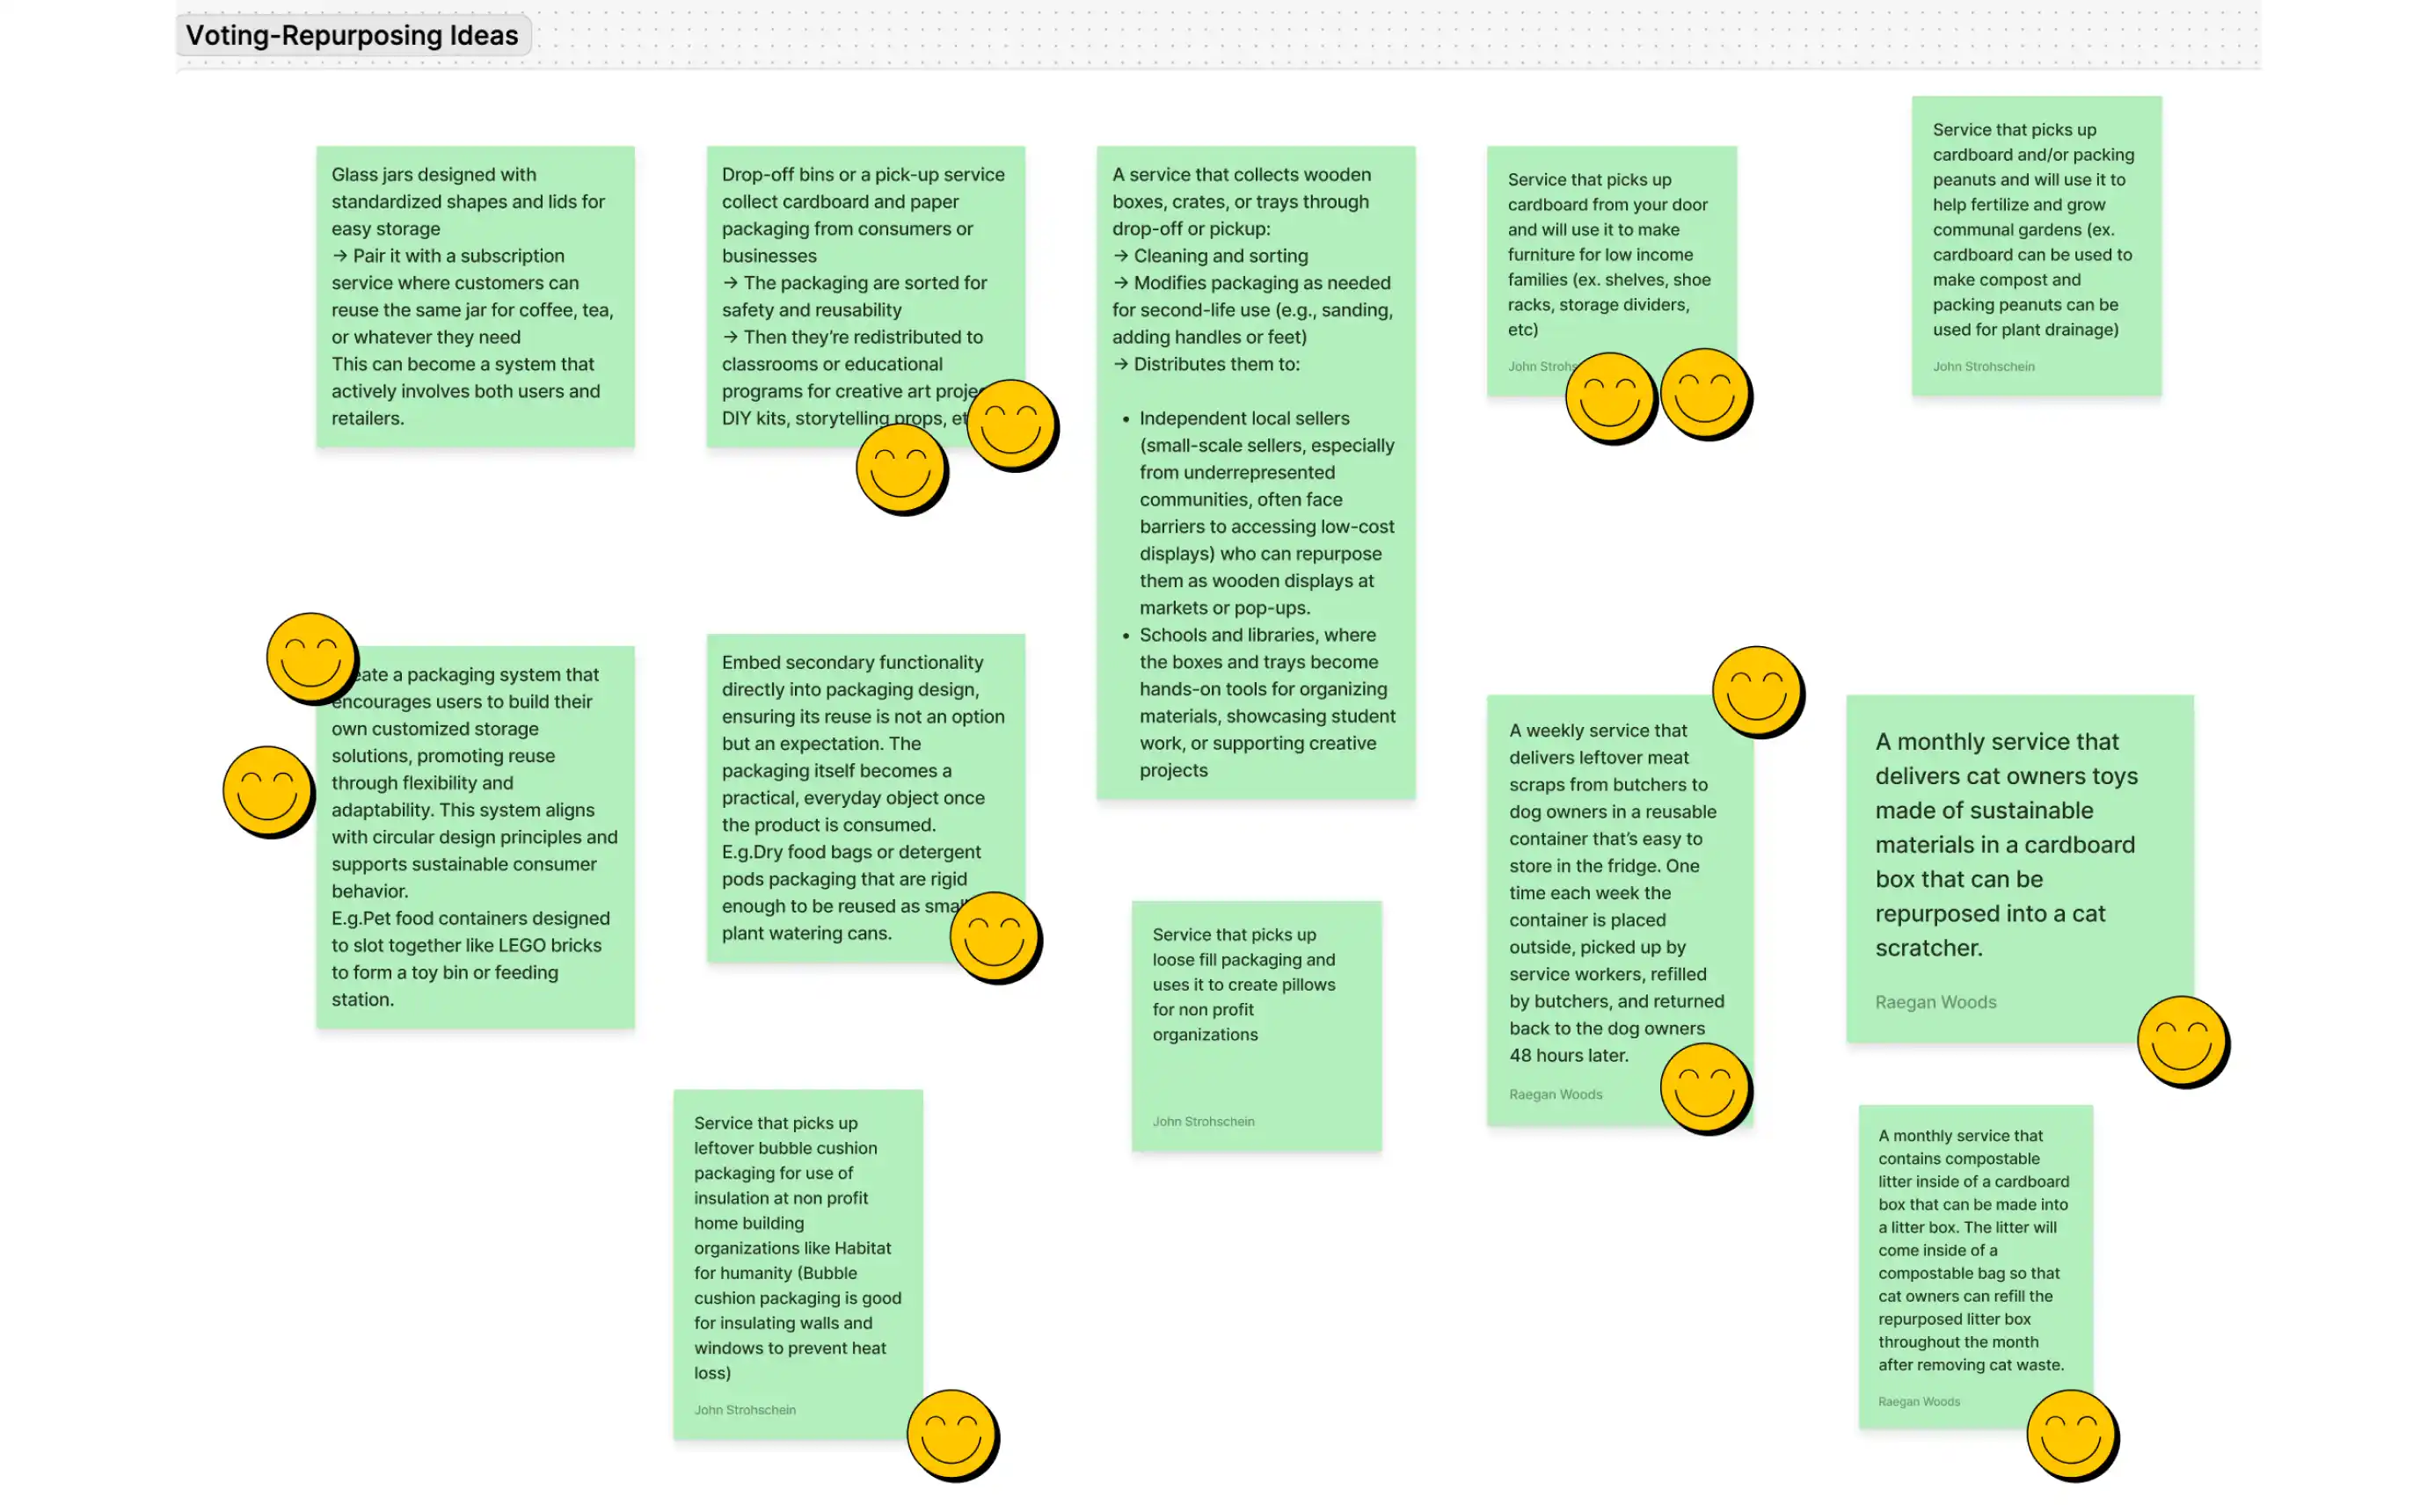
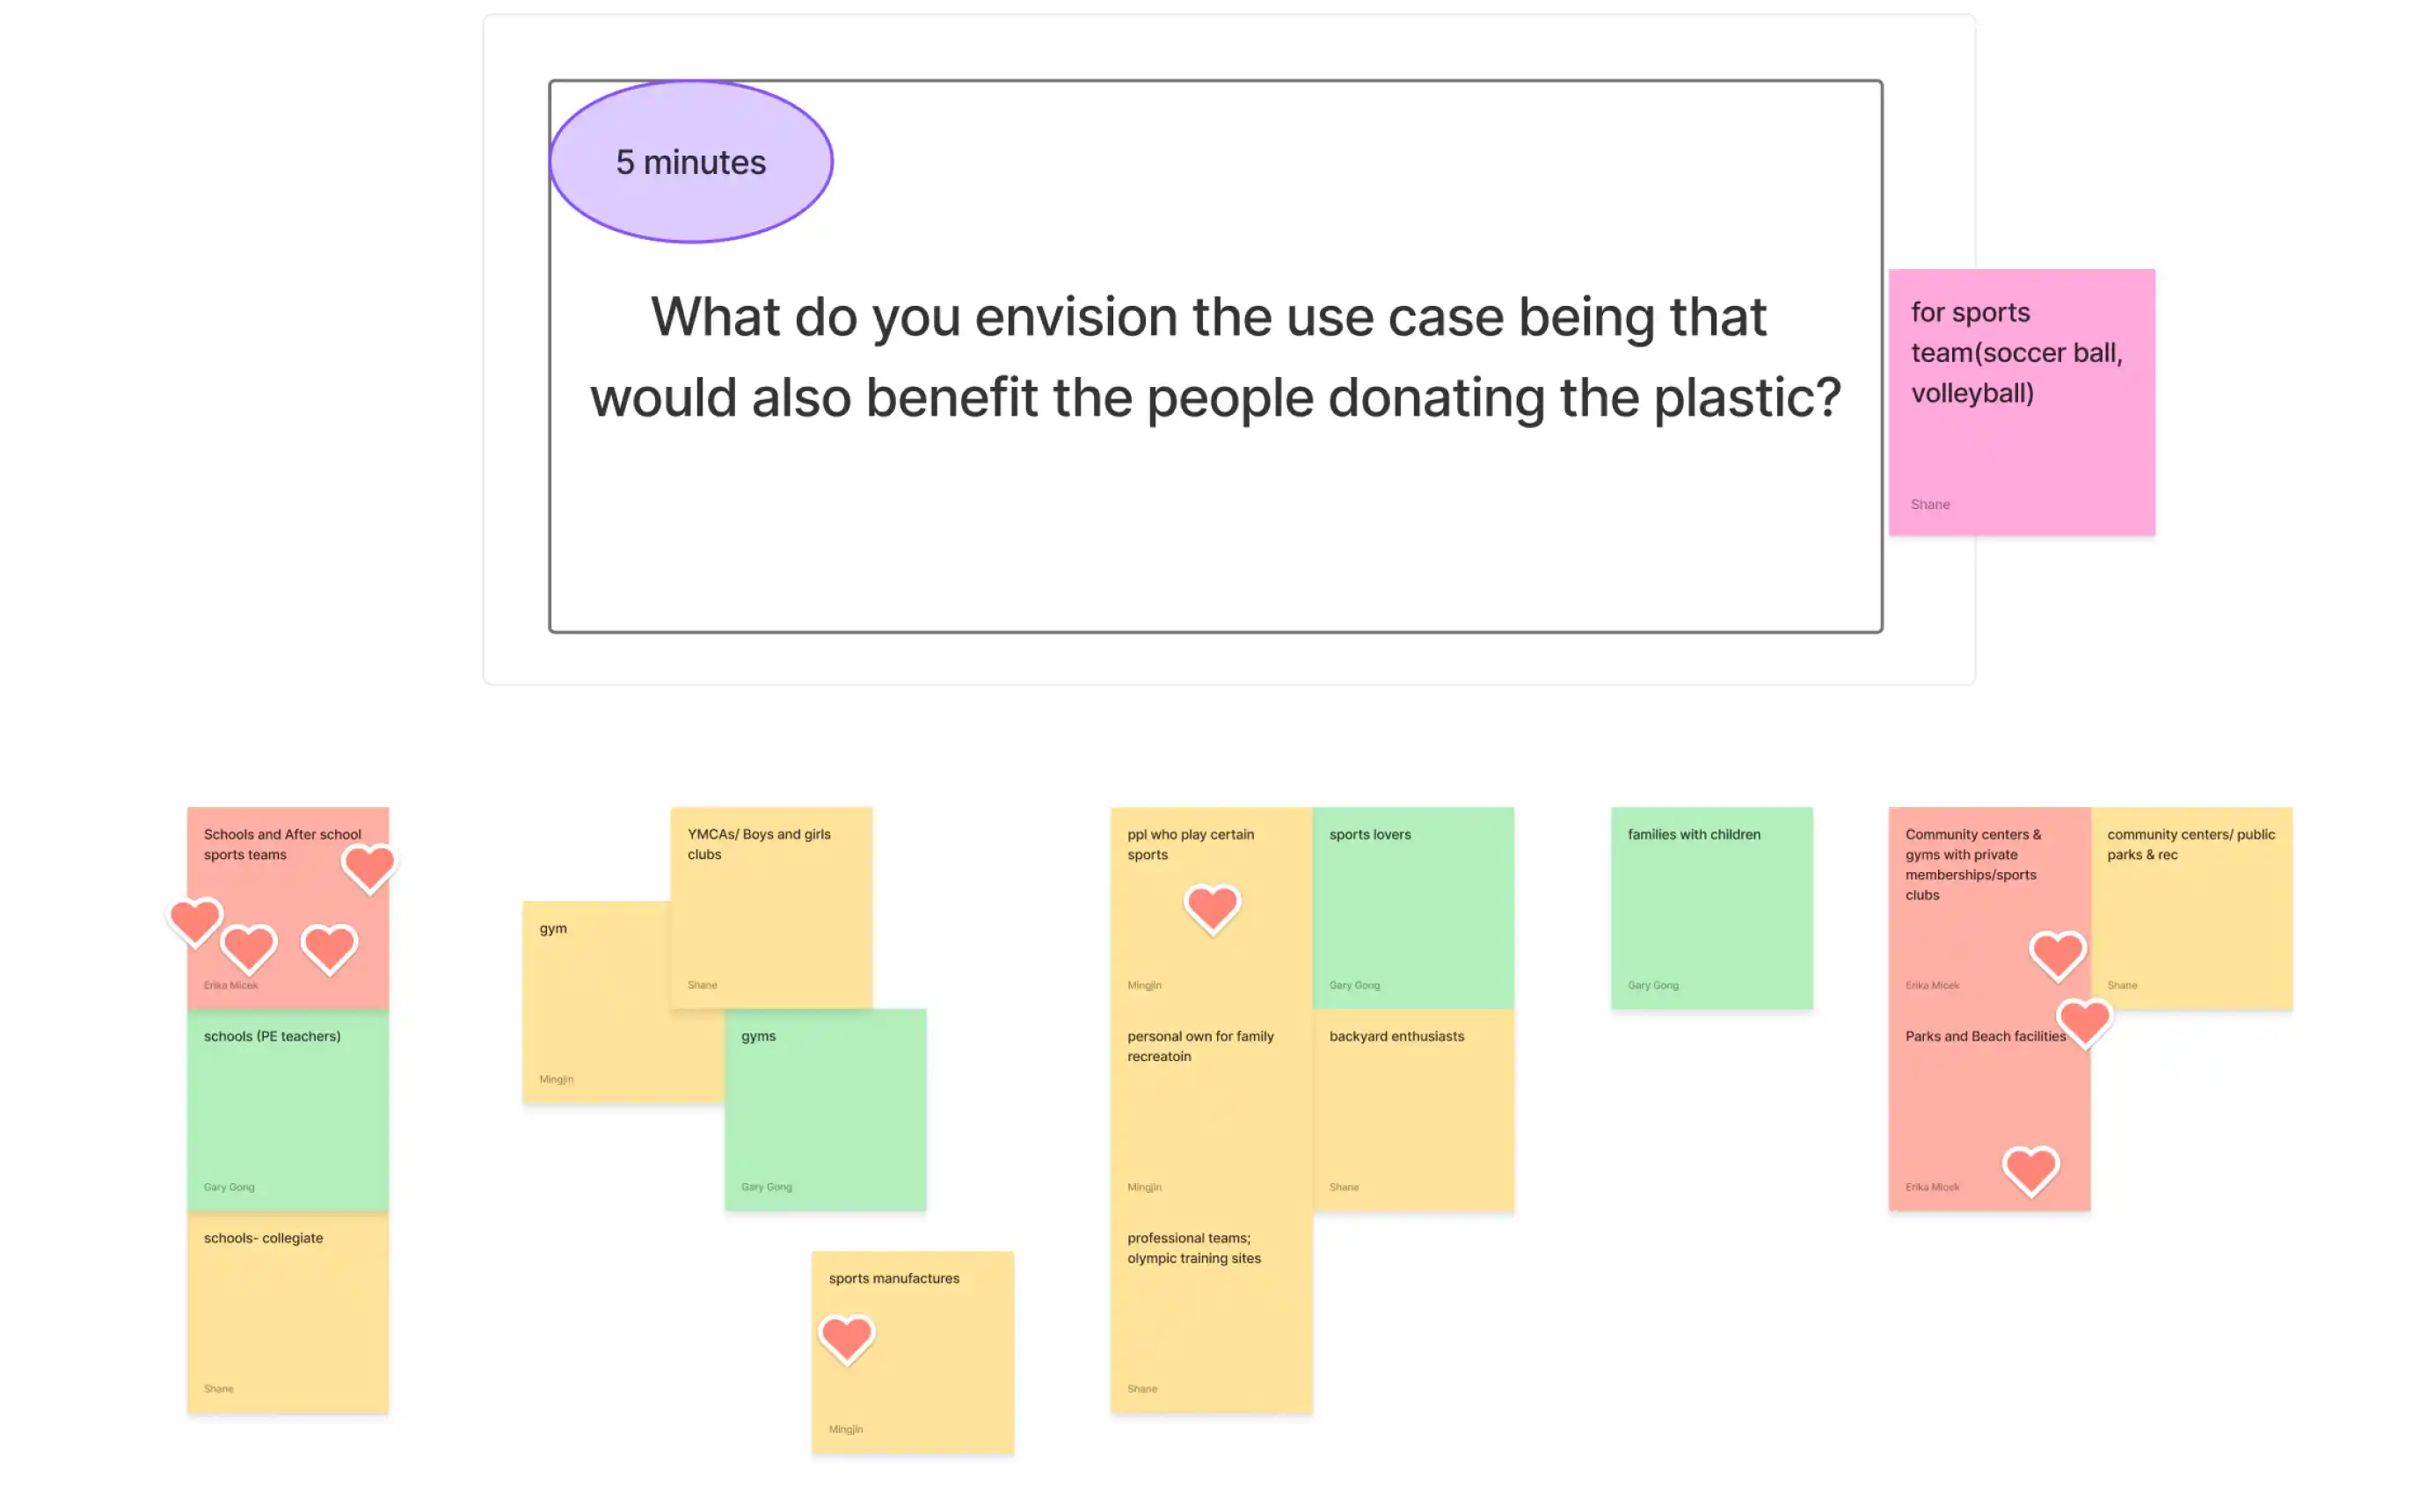
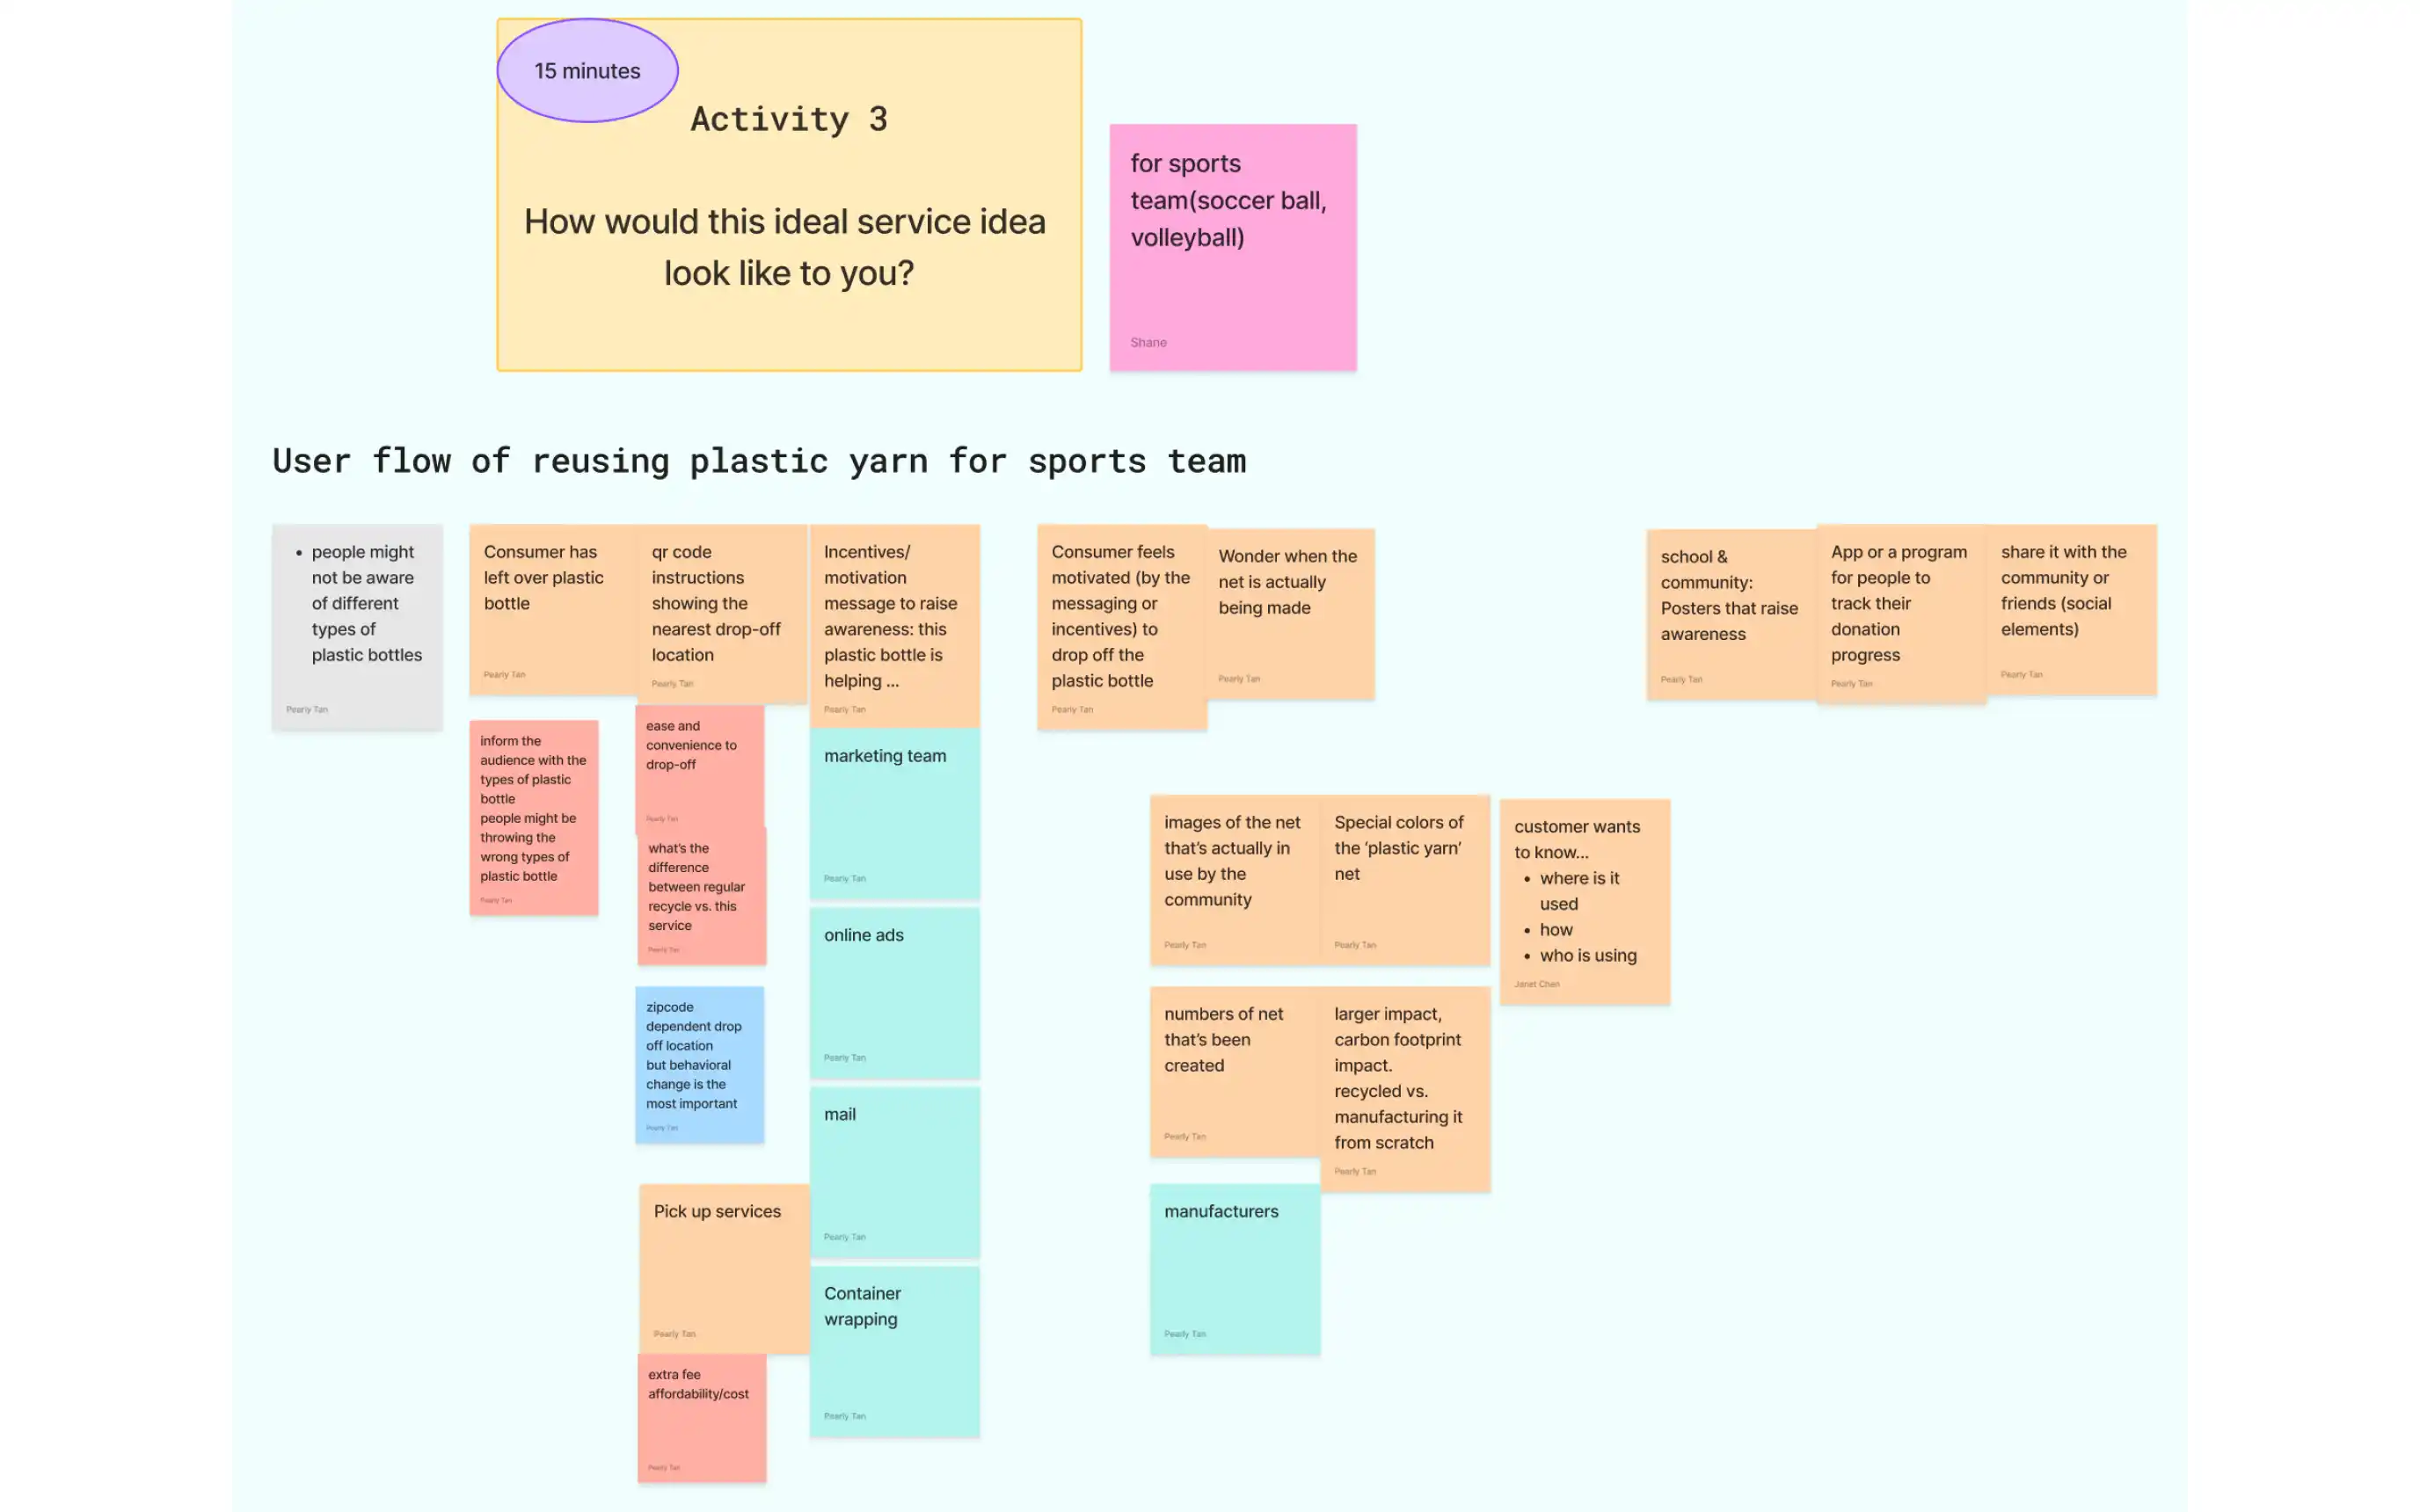
Co-design workshop revealed actionable design opportunities:
Participants emphasized the need for clear awareness, visible impact, convenience, and social sharing, guiding us toward a service that’s motivating, visible, and easy to act on.
Opportunity Framing
Value Proposition
01
Community
Turning local effort into local pride, I aim to design a service where communities work toward a shared goal and see their impact benefit those around them.
02
Sustainability
The service aims to reduce environmental impact by giving plastic waste a purposeful second life.
03
Affordability
The service should stay accessible and practical for everyday community use, not just a trendy, short-lived solution.
Before defining the solution, I identified the core values that the service needs to uphold.
Brainstorming
From Values to Concepts
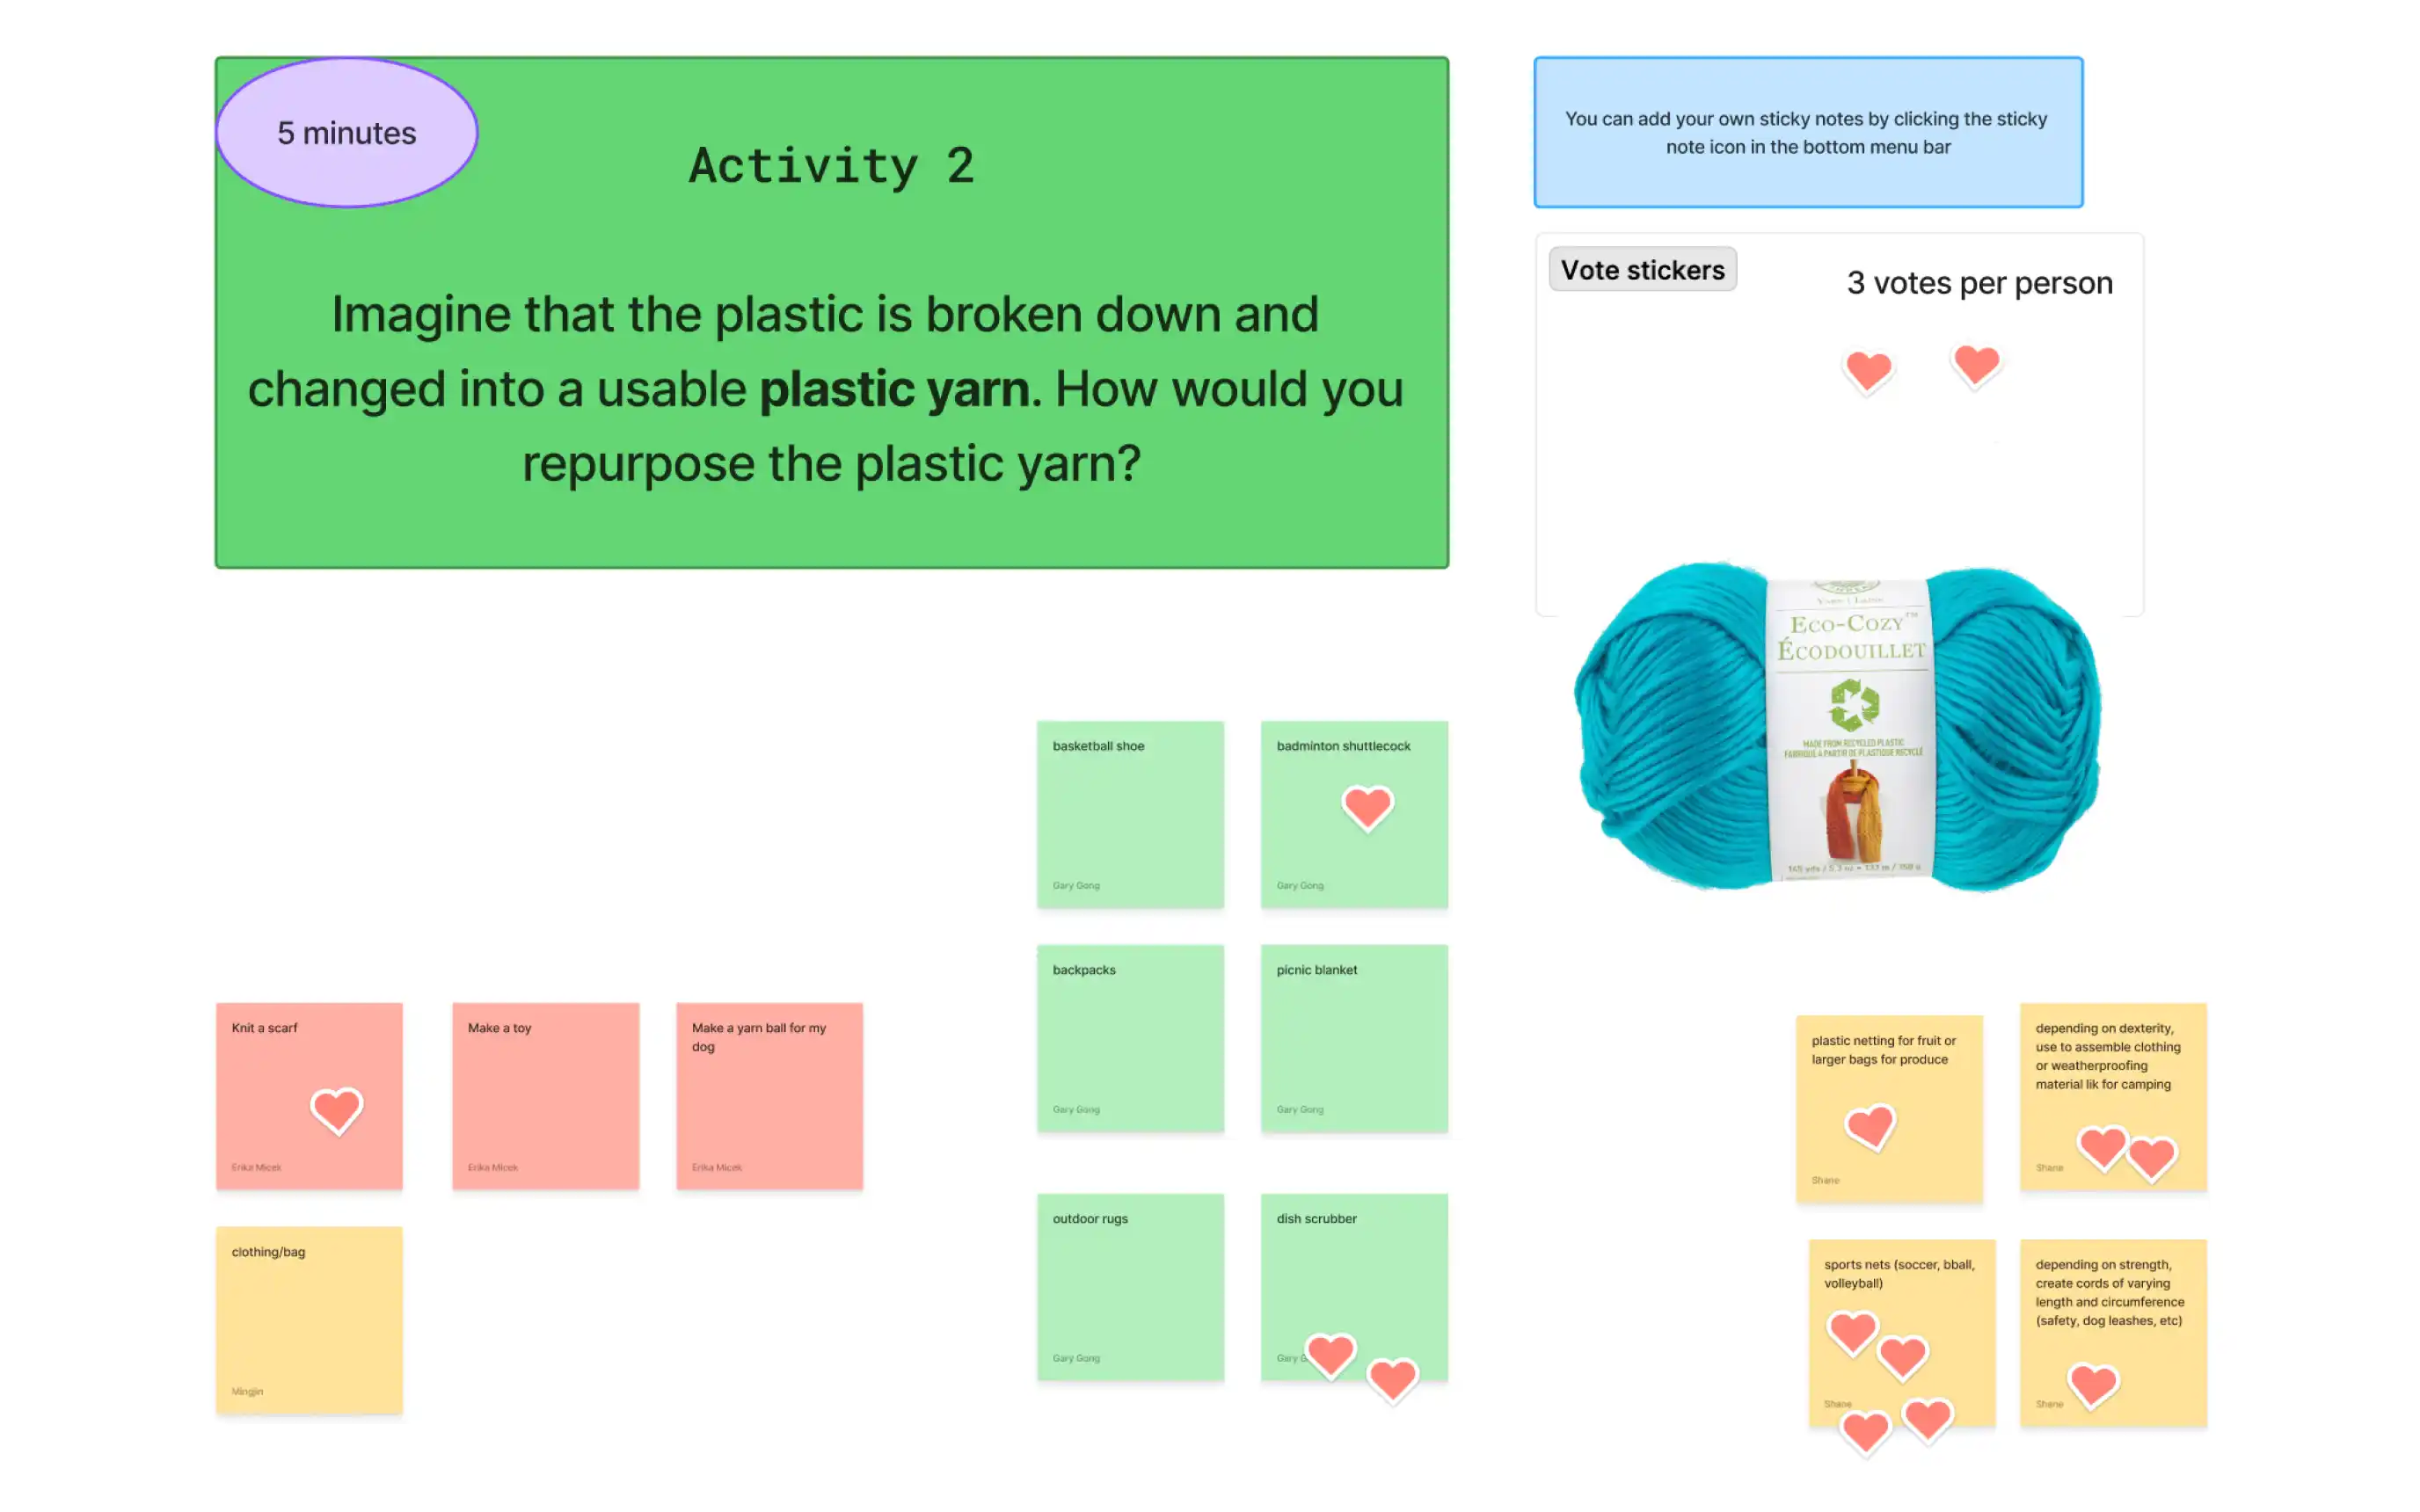
Guided by our core values, we brainstormed with a wide range of reuse ideas.
Research on high-tech companies turning bottles into yarn helped us see the potential in this material, which leads us to focus on plastic yarn as a viable and impactful direction.

This is Plarn (plastic + yarn)!
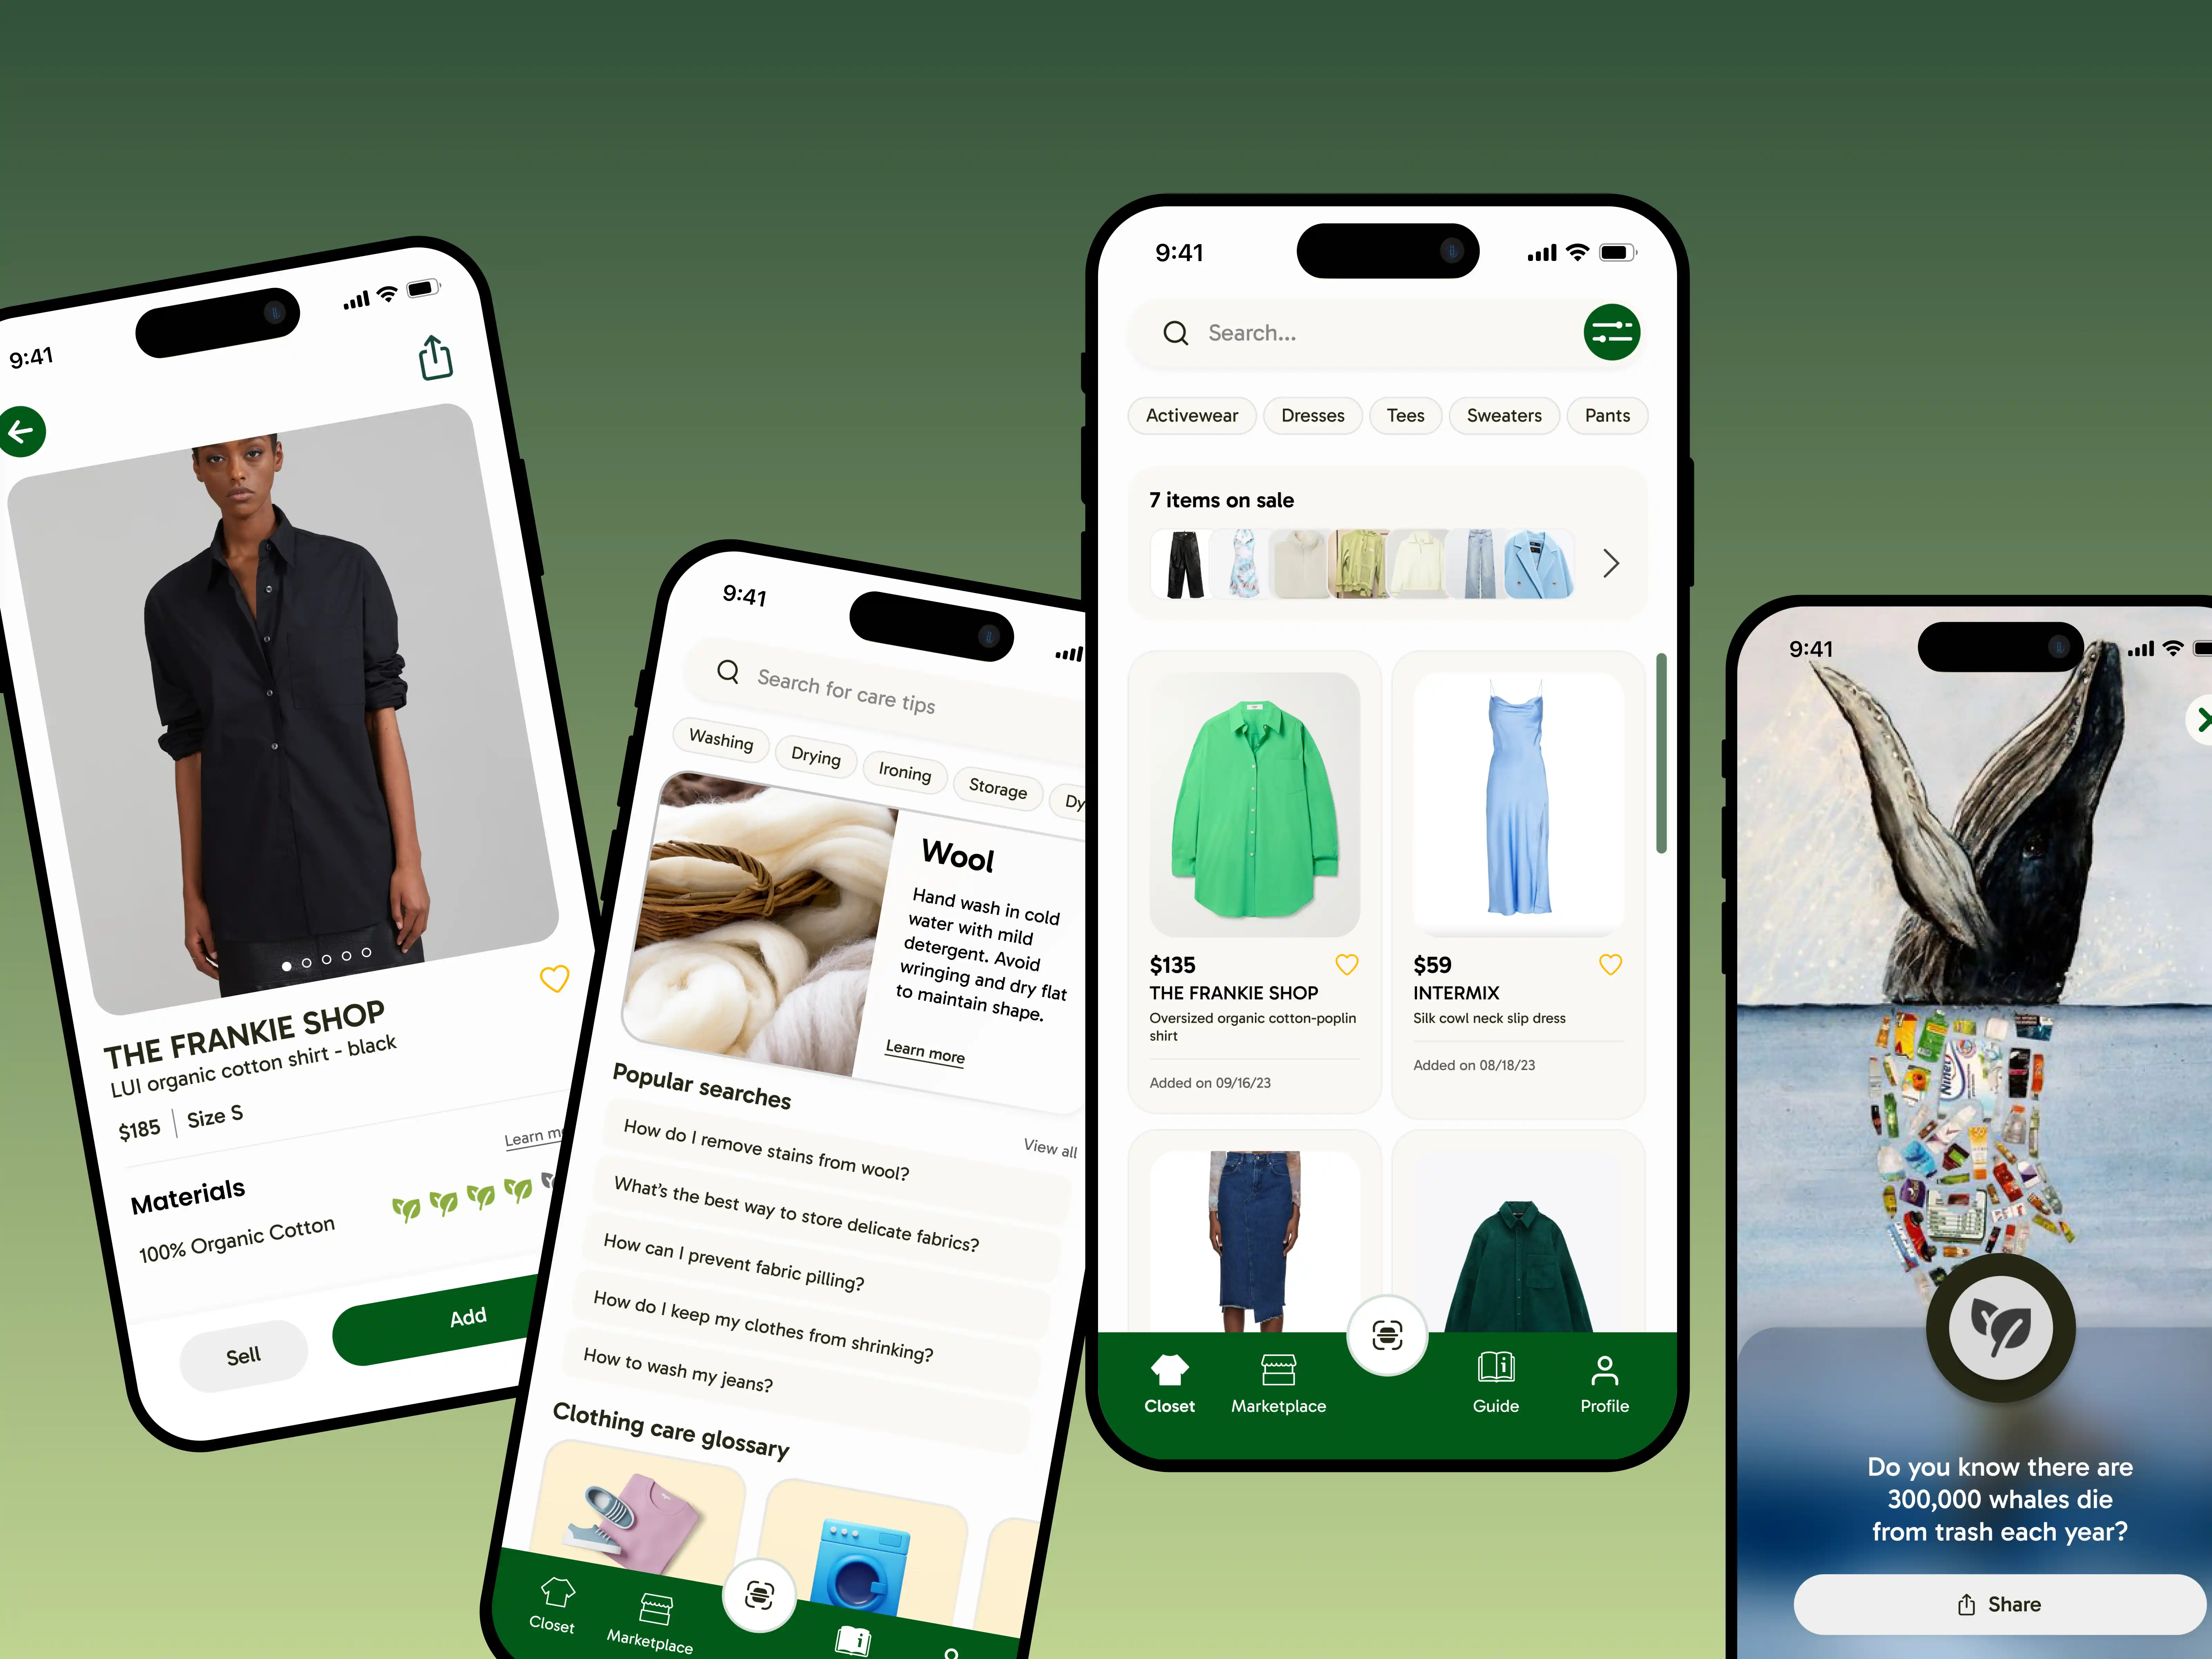
1st Rapid Prototyping
Exploring the B2C Path
onboarding
homepage
plastic bottles drop-off
Introduces the service’s purpose and core values.
Show progress of local school projects to encourage bottle donations.
Step-by-step guide for donating and counting bottles by size.
But, we got some pushbacks during class critique… 🤔
Critique
Spotting Friction in the B2C Model
During in-class critique, we were challenged on the justification for our consumer-facing model, pointing out low motivation, high effort, and unclear value for users. This pushed us to reconsider our direction.
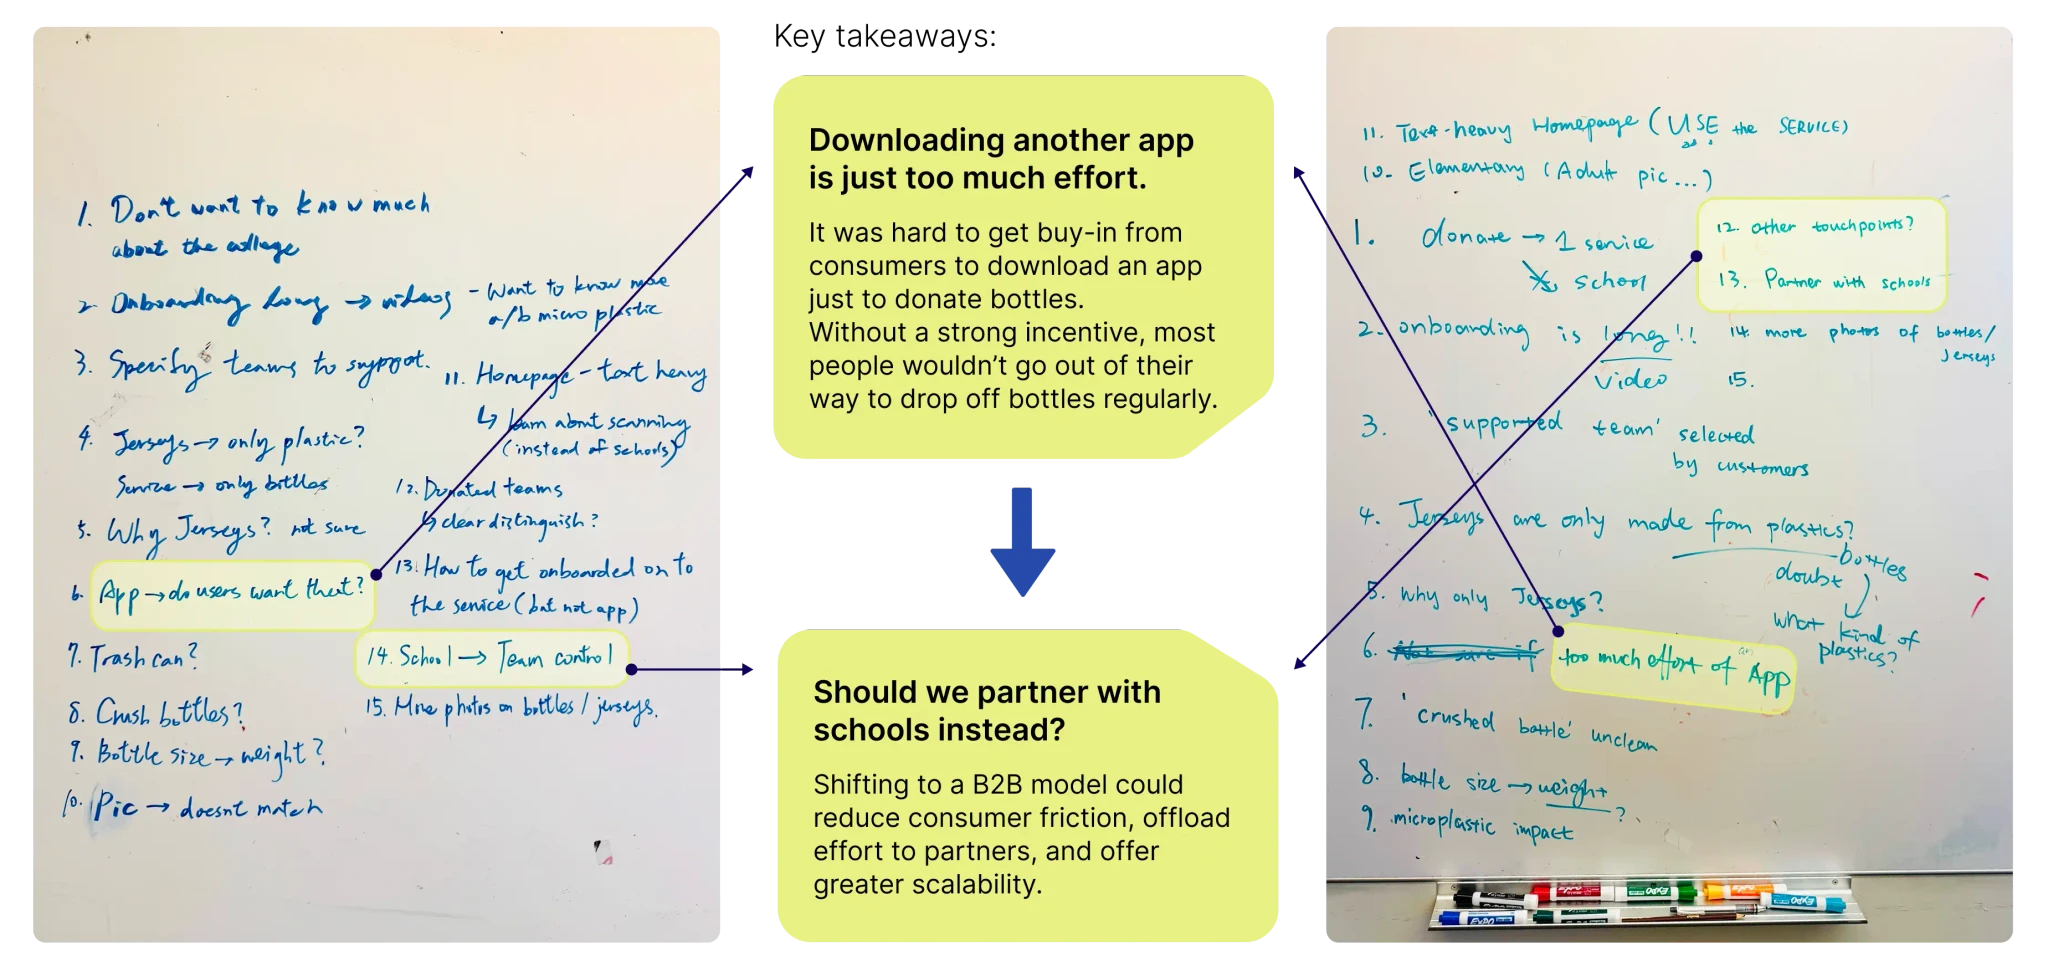
NOTES TAKEN DURING IN-CLASS CRITIQUE
Design Pivot
Repositioning to B2B
Before: B2C Model
Entry Point
Consumers download app to donate bottles
Bottle collection
Consumers find drop-off site and self-tracks contribution
MOTIVATION
Individual impact and environmental awareness
adoption barrier
High - add download & extra effort
Scalability
Limited - depends on individual participation
After: B2B (School Partnership)
School initiates campaign with our guidance and assigns students
Sports team students go door-to-door to collect plastic bottles
Students earn affordable team jerseys through their own collection efforts
Low - embedded in school activities and team goals
High - leverages existing school networks and outreach
To guide the pivot, we created a B2C vs. B2B comparison, examining entry points, motivation, and more.
Design Process
Rapid Design Iterations
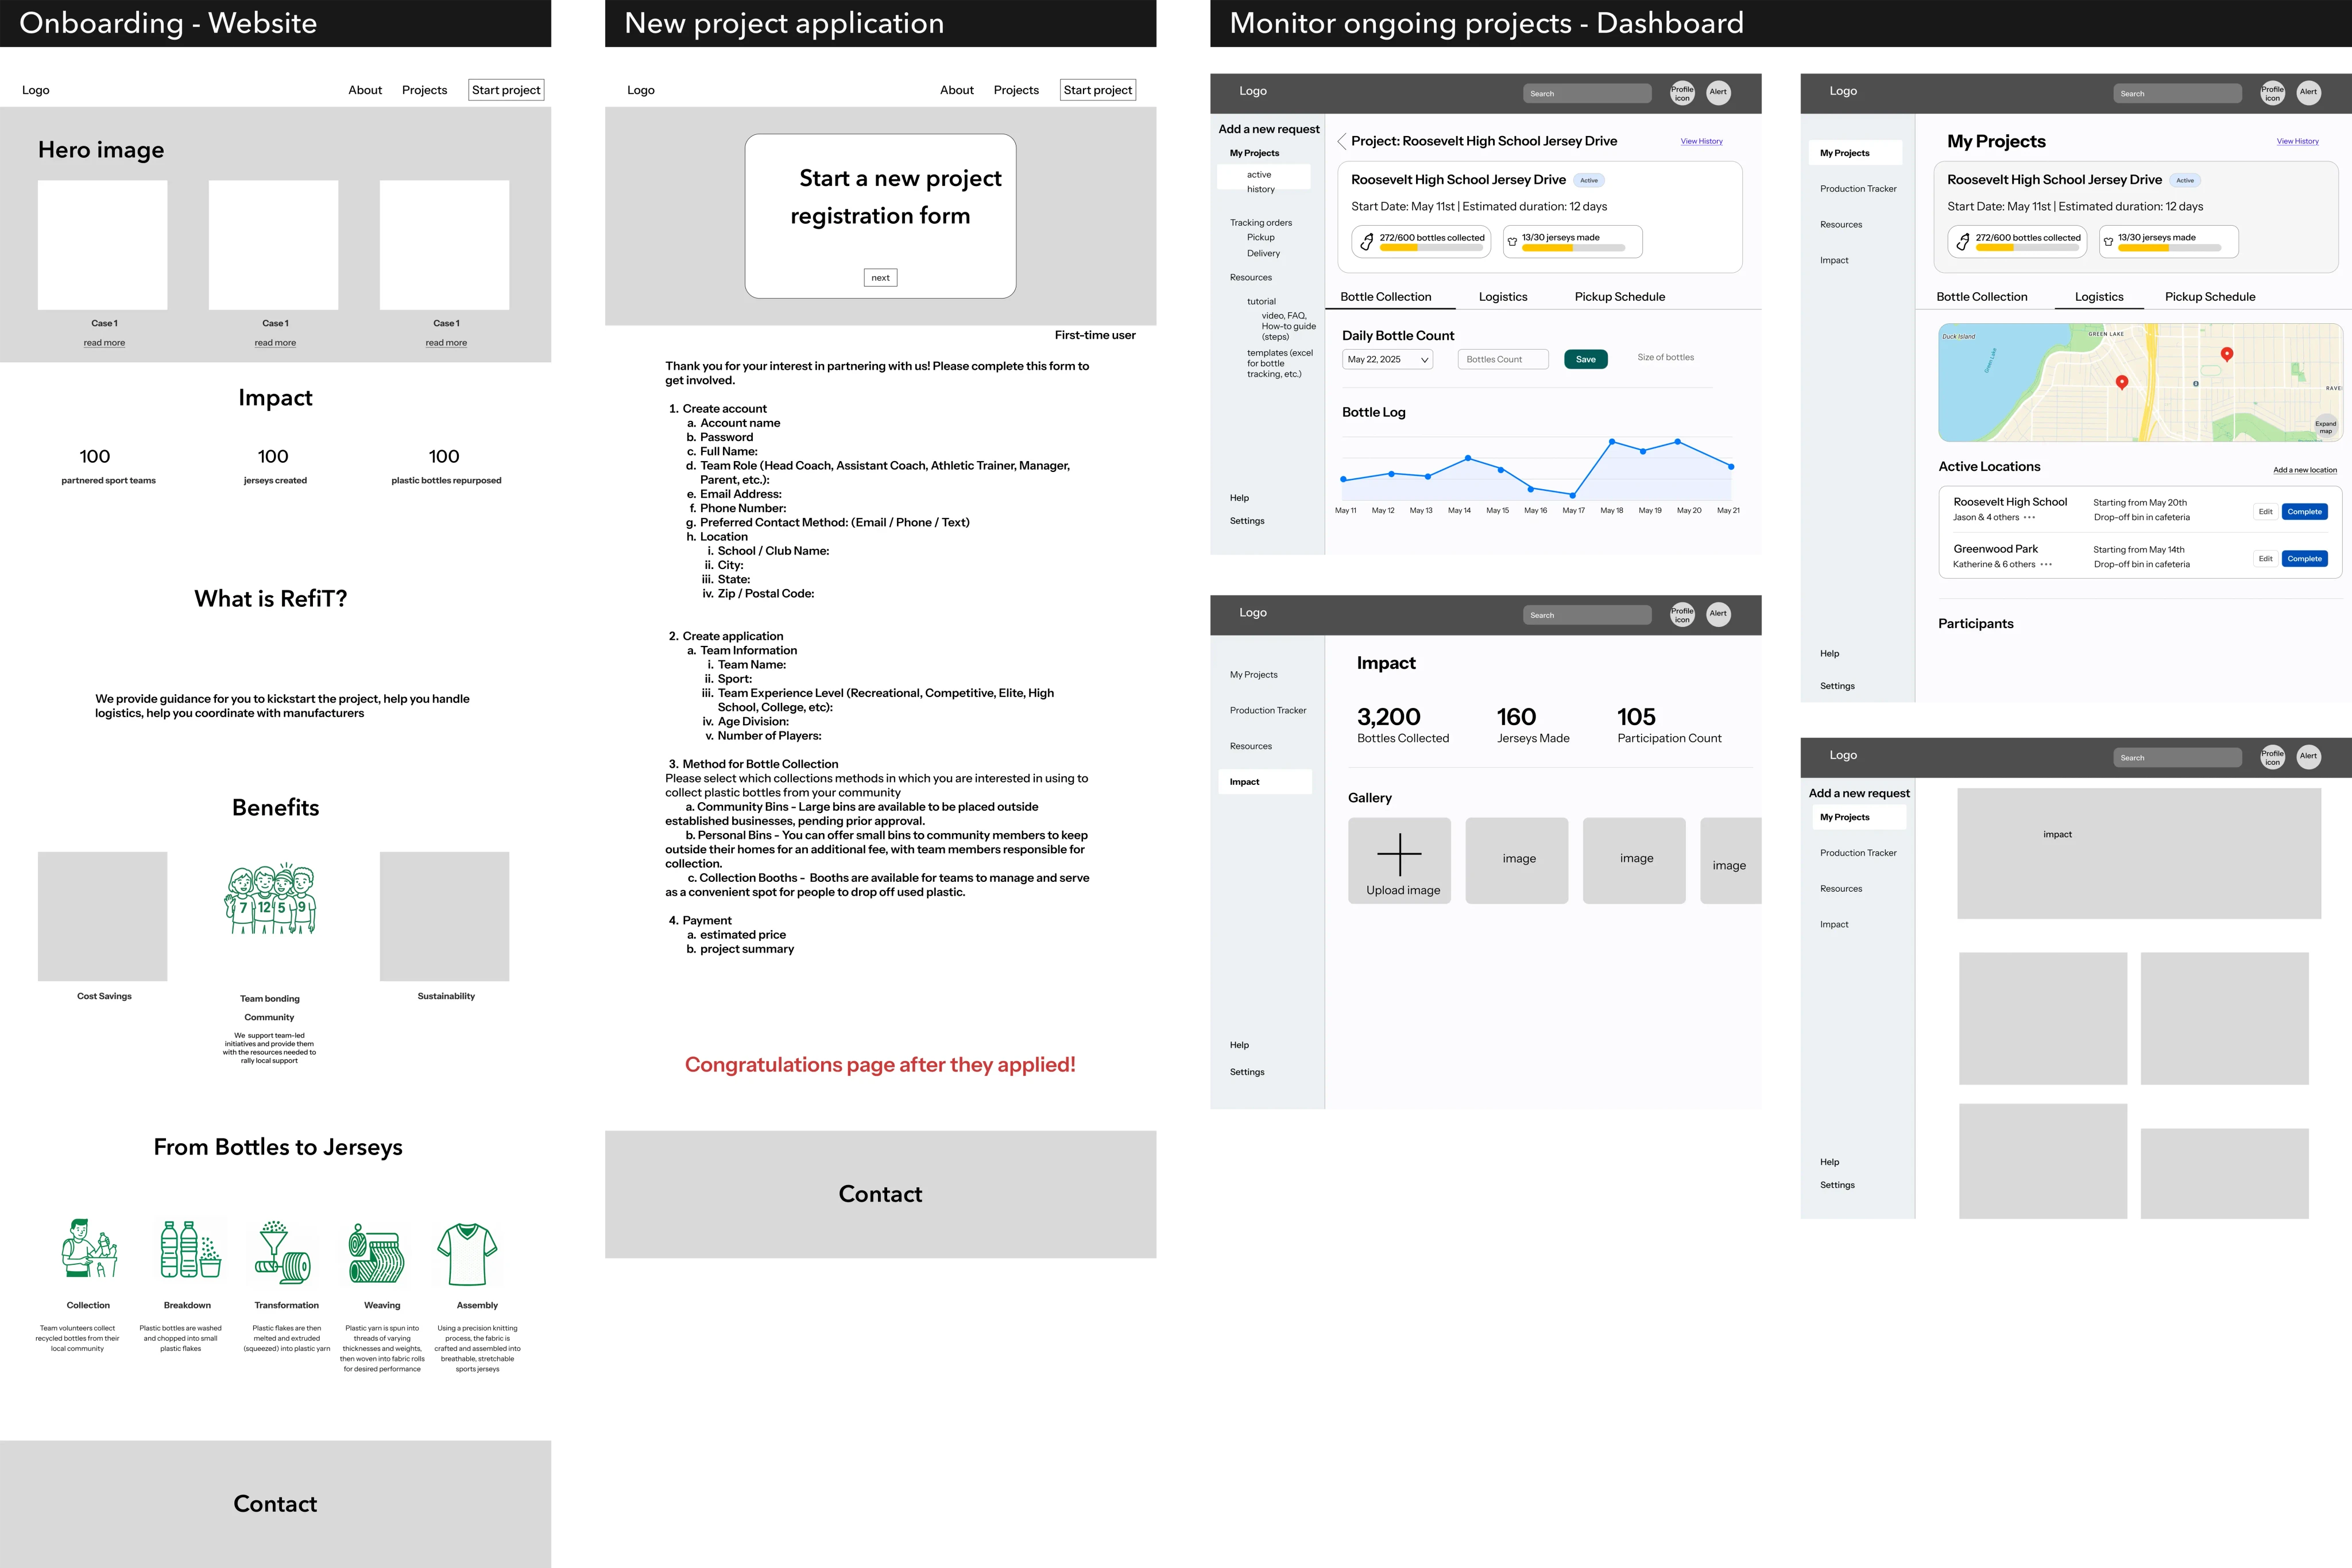
LOW-FIDELITY WIREFRAMES
Within a day, another designer and I developed wireframes for 3 core user flows that are essential to our service.
Website – The public entry point to learn about our service’s values and benefits, and where users begin a project.
Registration Form – Collects school and team info to tailor service offerings.
Dashboard – Enables partners to track progress and manage ongoing projects.
*I solely owned the design of the dashboard, while also contributing design ideas and design system alignment for the website.
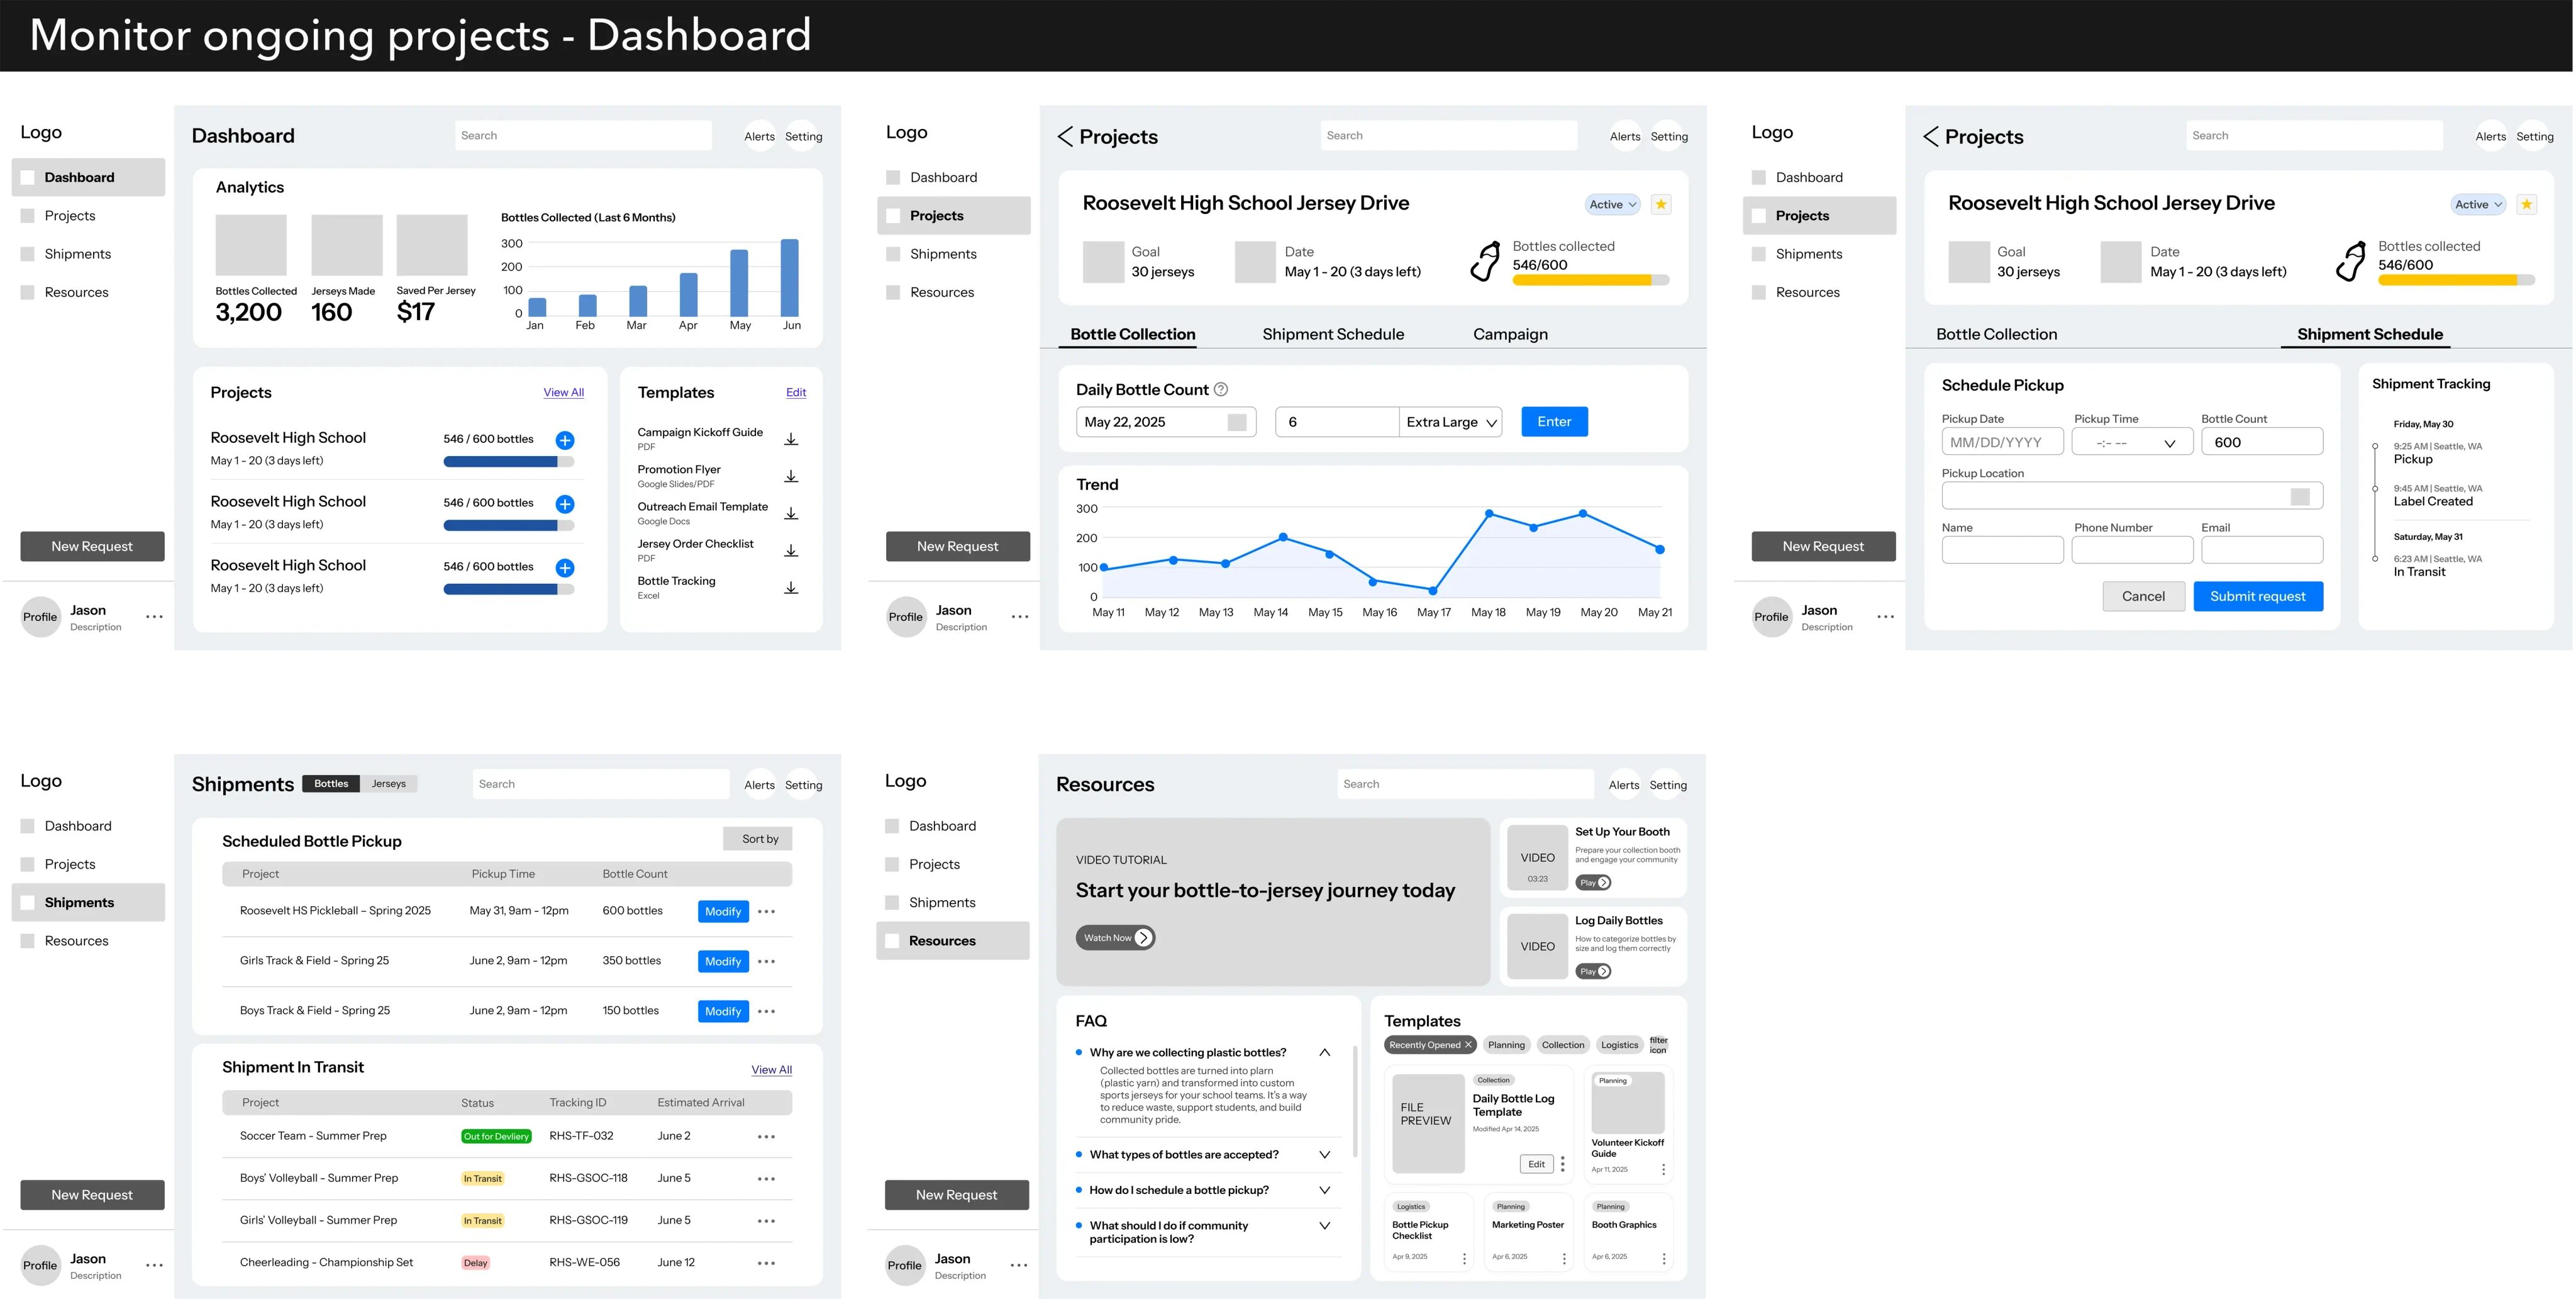
MID-FIDELITY WIREFRAMES
Based on testing and feedback, I prioritized the dashboard for our final showcase. It’s the core touchpoint users interact with throughout the service.
I focused on designing three key functions to support their experience:
Dashboard Overview – See project status at a glance
Bottle Collection & Shipment – Track progress and manage logistics
Campaign Resources – Access tools to kickstart collection efforts
Usability Testing & User Feedback
Standardizing Counting to Reduce User Effort
Before

After

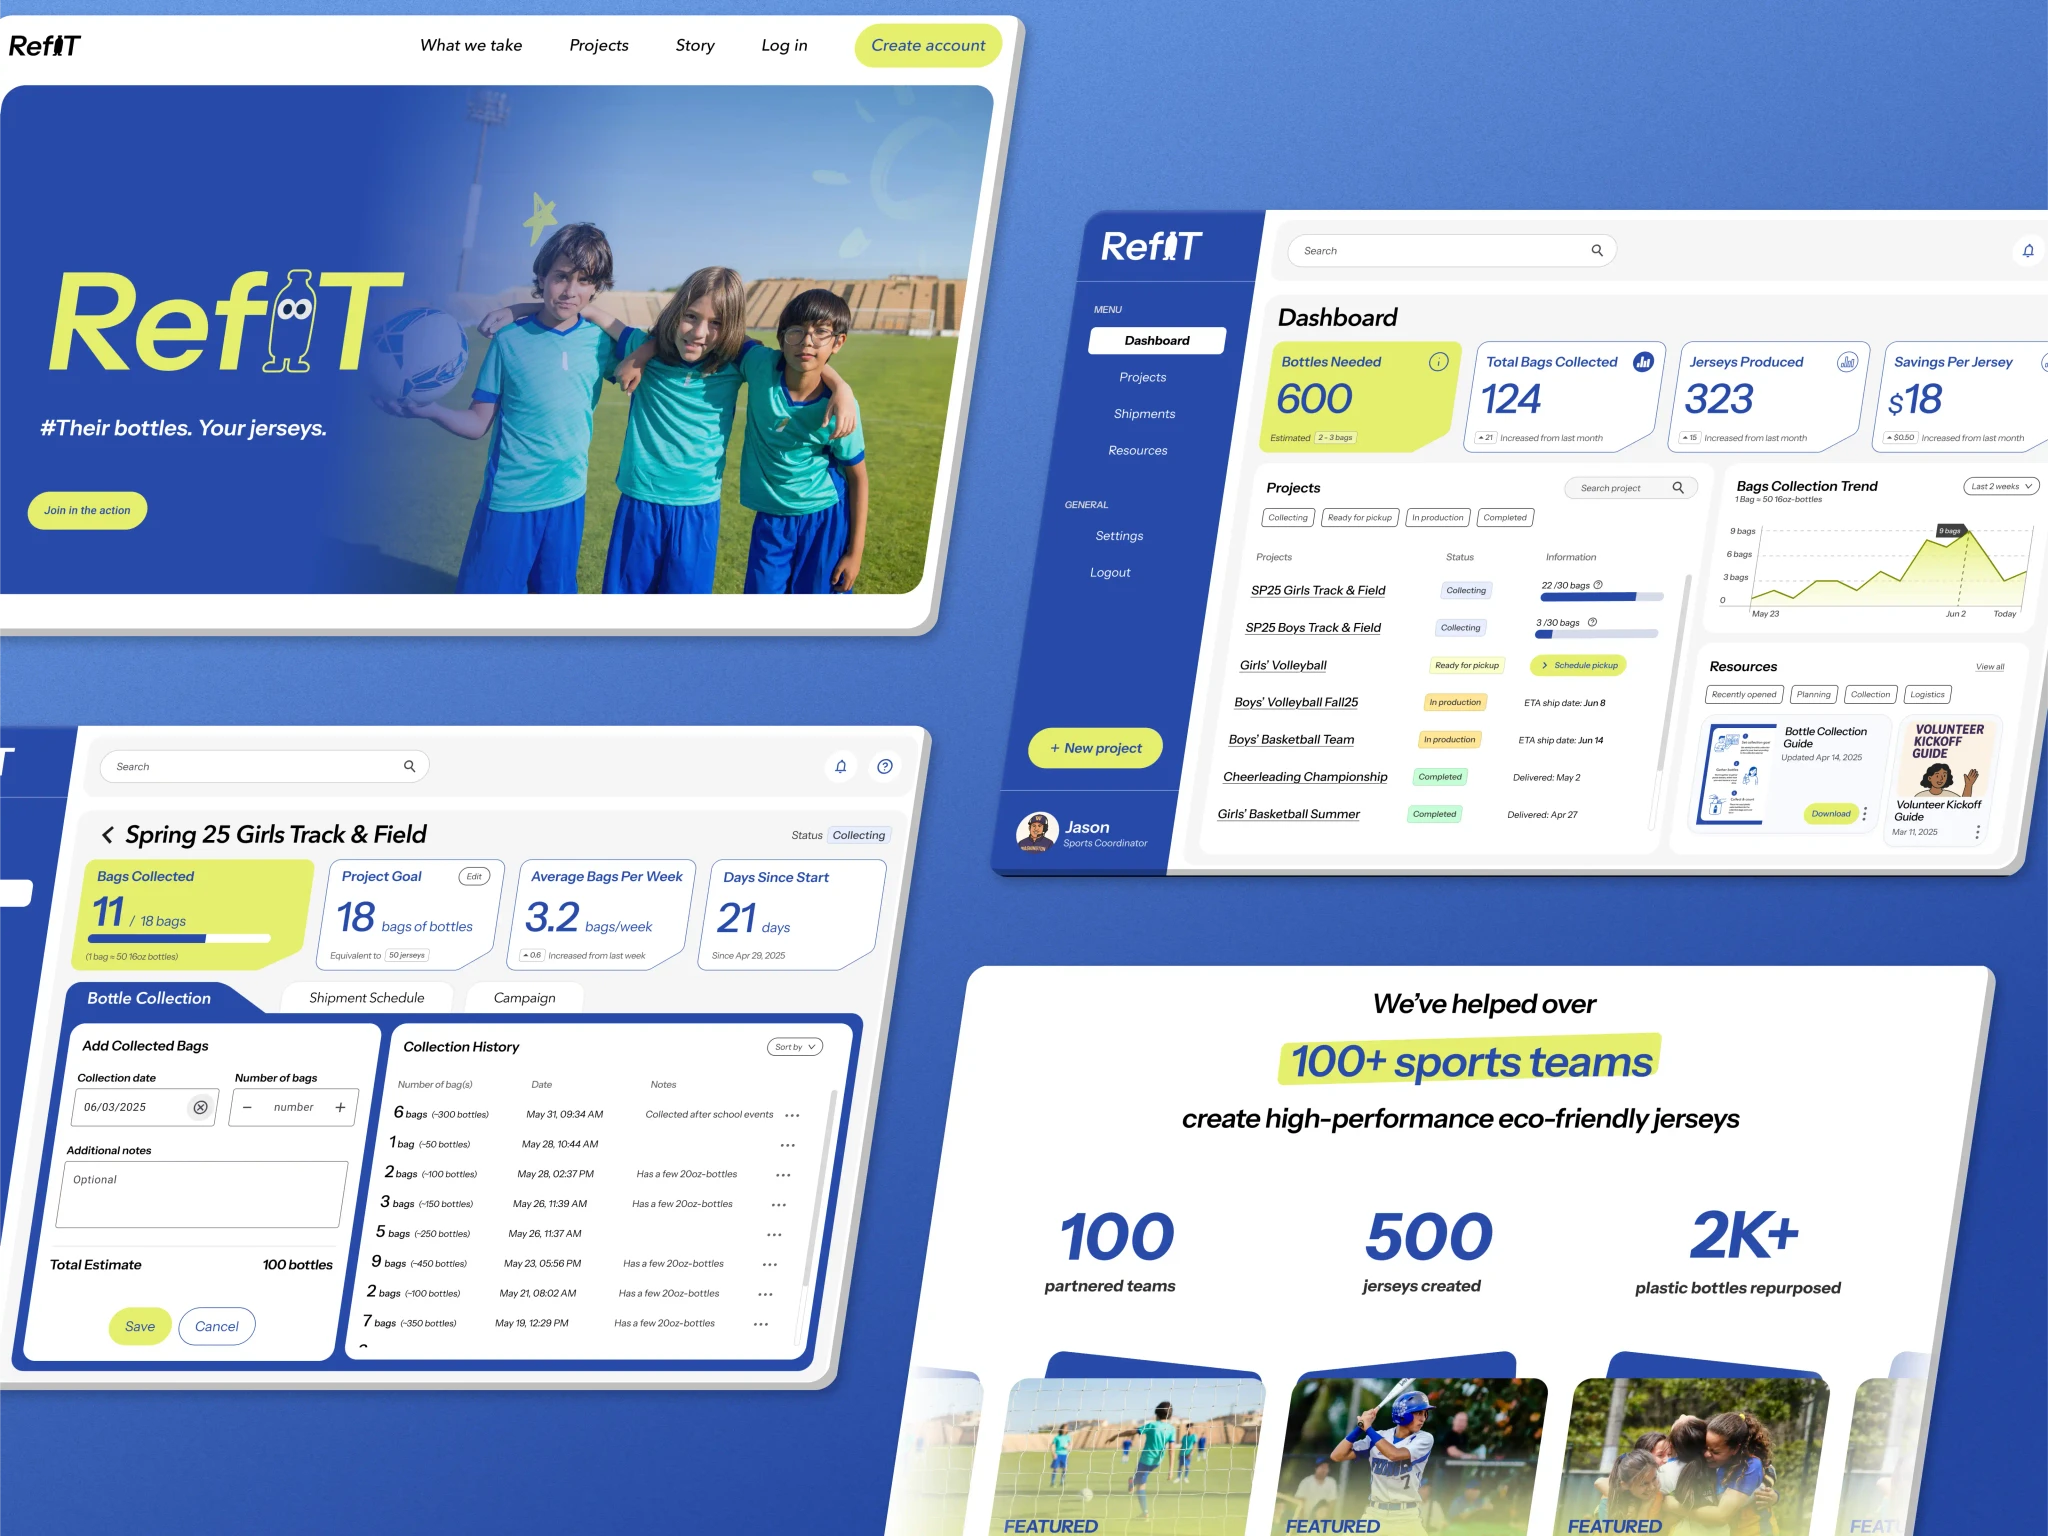
The Solution
'RefiT' Service
dashboard for daily monitoring & management
New project application
Service website
Reflection
What did I learn?
01
Service value must align with real needs
A service creates real value when business goals align with user motivation. Our B2C to B2B pivot taught me to design for both intent and real-world behavior.
02
Open to feedback, even rethink everything
The best feedback challenged our whole model, not just a screen. Being open to pivoting early helped us land on a solution that was more scalable and grounded in user reality.